Why SEOs Are Embracing Content Marketing
The bottom line is that when you add great content to your website on a regular basis and get the word out about it to your target audience, you’ll gain more rankings, traffic, conversions, leads and sales.
The key, of course, is that word “great.” Adding just any content won’t provide the results you’re looking for. But how do you know if your content is great? That’s where having some definitive content marketing metrics in place will help. And we’re lucky today to have gazillions of tools to help with this. You’ll know if your content is resonating with your target market by reviewing some very specific metrics on a regular basis.
Google Analytics to the Rescue!
You all know by now that I’m a Google Analytics junky. I’ve showed you in the past the bare minimum metrics you should be looking at when doing any sort of SEO for a website. Today I’m going to take you one step further by showing you the metrics you should be looking at for each individual piece of content that you publish on your website. (And if you stick with me, I’ll provide you with a bonus Content Marketing Metrics Dashboard that you can use for your own measurements.)
PageViews
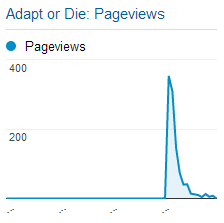
I’m typically not a big fan of PageViews as a measure of success. But with content marketing, especially when any piece is newly published, it’s worth a look. Don’t be surprised if a lot of your PageView data for your content looks like this:
PageViews
It’s normal to get a spike in PageViews when the content is new and being promoted via various channels, and then for it to die down. It’s worth looking at because you want to find the content that continues to be viewed after the initial spike.
PageViews
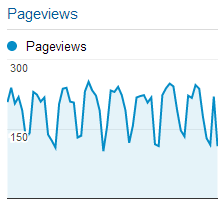
When you see consistent PageViews month after month, you know you’re on to something! You can use that information when deciding on future content topics.
Organic Keywords and Rankings
Ha! I bet you’re surprised to see me mention rankings given that I recently wrote that running ranking reports is a fool’s errand. They still are, BUT…as I stated in that article, there’s an obvious correlation between rankings and getting organic search traffic to your site. So knowing which keywords bring traffic and where your content ranked when someone clicked on it in Google provides you with interesting and useful data. Unfortunately, there are no out-of-the-box ranking reports within Google Analytics. But if you can add a bit of code to the pages of your site, there is a new method of gaining this valuable insight within Google Analytics.
See GA Evangelist Justin Cutroni’s post on how to set the Rank Tracker up here.
I’ve had the Rank Tracker code on my site since the middle of January this year and am excited by the information it provides. To finally have a way to know the approximate rankings for phrases that actually bring traffic to my site is pretty amazing! For instance, I now know that the average ranking for ALL organic keyword traffic to my site is 5.34.
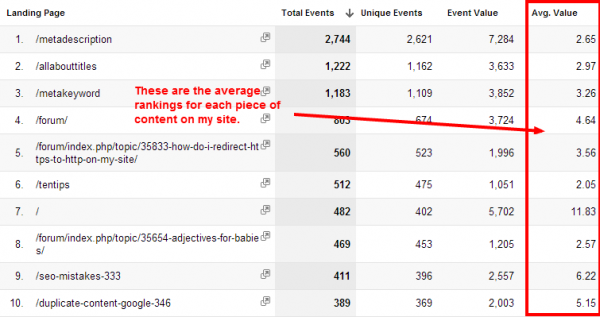
But even more exciting is to see the average ranking for any new (or old) piece of content:
Average Ranking
I now know that my Meta Description article (which is the most visited landing page of my site) is generally ranked between position 2 and 3 (2.65 average ranking) when it’s clicked on from Google. And if I want, I can see the average rankings for each of the 500+ different keyword phrases that brought traffic in for that article.
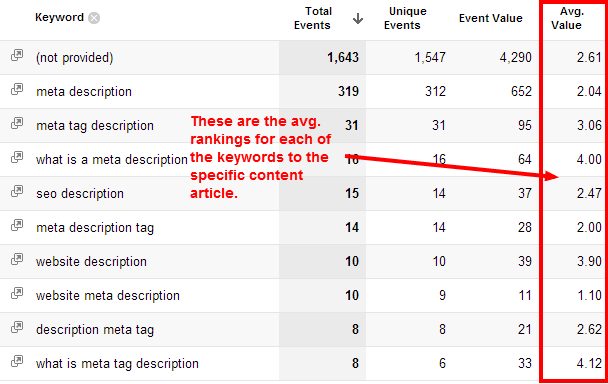
While not every piece of content on your site will (or should) bring organic traffic, it’s certainly something you want to look at.
Referring Traffic
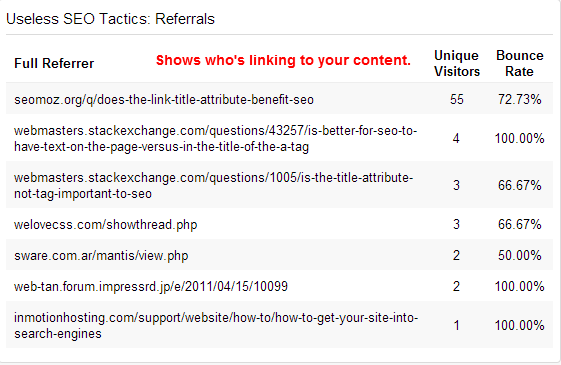
Beyond search engines, you’ll definitely want to keep track of where each piece of content is getting referral traffic from. This will show you the important sites that are linking to it — that is, those that bring you visitors.
Referring Traffic
For purposes of seeing where your content is linked to, you’ll need to filter out all the referrals that come from web-based email programs, as well as social media referrals (which we’ll look at next).
Social Networks
Google Analytics has added a lot of social data over the past year. While you might get better information from your own social media tools, it’s still worth taking a look at what you’ll find in GA.
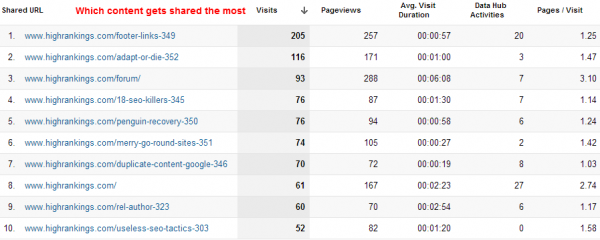
You can see which content is getting shared the most:
Social Networks
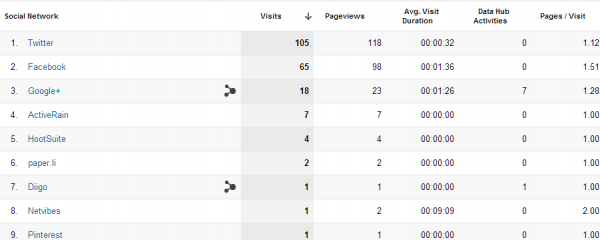
And you can click on the shared URLs to see which social networks bring the most visits and PageViews:
Conversions
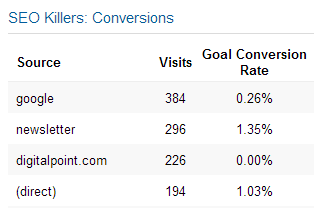
Last but not least is the holy grail of your content marketing efforts — conversions. First, remember that you should have a variety of conversion points on your website. Also note that content marketing doesn’t always lead directly to conversions.
Measuring Conversions
That said, you can pretty much assume that if some of your content is leading directly to conversions, you’re on the right track (but it is going to depend on what you’re counting as a conversion).
Your Content Marketing Metrics Dashboard
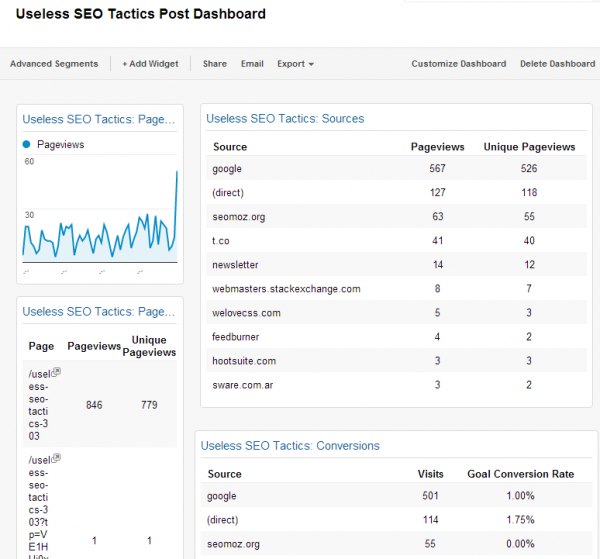
While you can look up all of the above separately in your Google Analytics, I’ve found it most helpful to have a specific content dashboard for each URL. In other words, every time I publish something to my website, I create a dashboard which shows me all of the information I talked about above (and more) all in one place.
Content Marketing Metrics Dashboard
The above image shows only a portion of the dashboard, but you get the idea.
Want your own Content Marketing Metrics Dashboard? You’re welcome to use mine! Here’s how:
While logged into your Google Analytics, click this link, and then choose the profile you want to associate it with. The dashboard will automatically be created for you. But wait — it won’t work yet because you have to assign some content to it.
Here are the steps to make it work with each of your own articles:
1. Make a copy of the generic dashboard so that you can keep that one handy when you create new content.
2. Hover over the top right corner of each widget on the dashboard to find the Edit button.
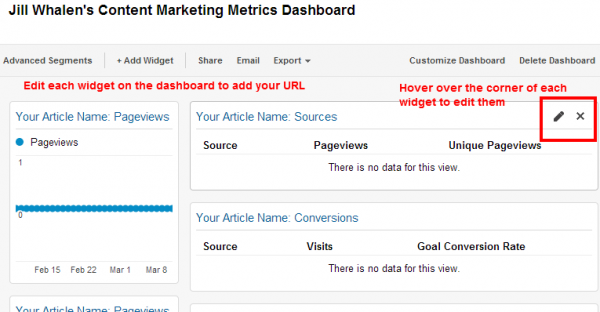
3. Replace “/your-article-url” and “Your Article Name” with your own, and do this for every widget on the dashboard. While this sounds like a lot of work, it should take less than 5 minutes. Be careful not to change anything else unless you know what you’re doing. The filters should all be set to work with almost everyone’s content. (However, the RankTracking widgets will work only if you’ve installed the additional code on your site.)
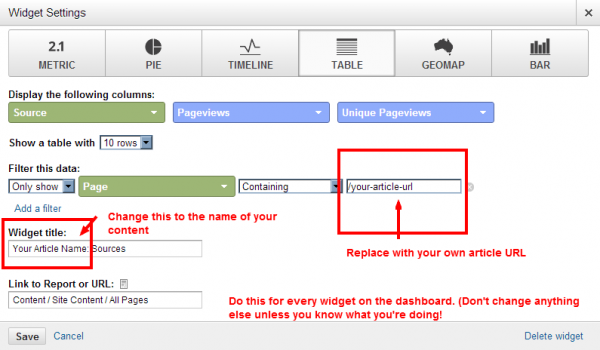
That’s it! You can use the same dashboard template and change it accordingly for each piece of content. Unfortunately, you can only have 20 dashboards per profile. After you use yours up you can delete old dashboards that you no longer use or better yet, just create additional profiles.
A post by Jill Whalen in http://www.sitepronews.com
Content Marketing Metrics Fun With Google Analytics